
The atmosphere is made up of molecules which all have weight, so at the surface all those molecules pressing down on us from above exert pressure. Standard sea-level pressure measures 14.7 pounds per square inch or 1013 millibars on weather maps.
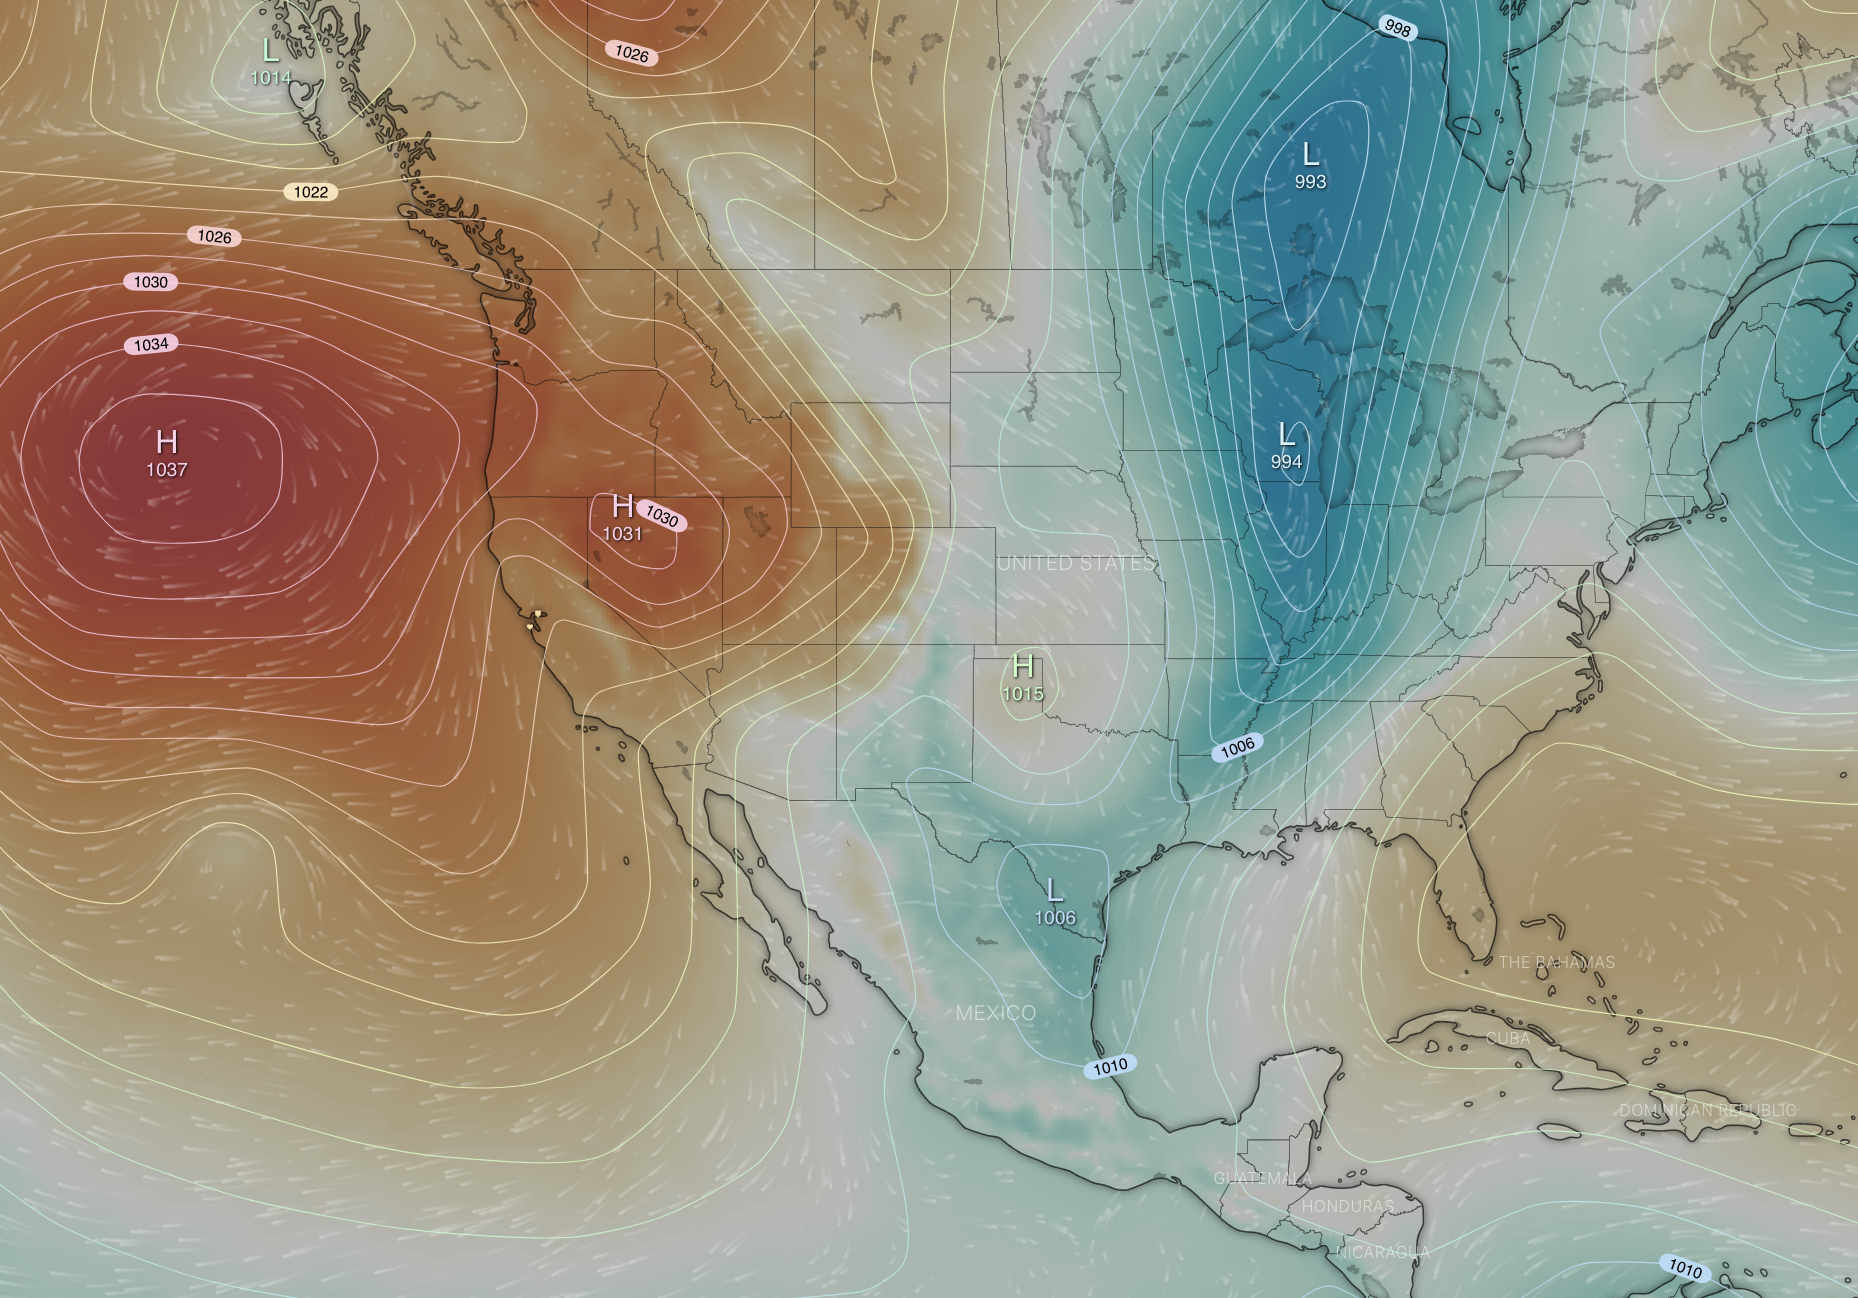
High Pressure Systems
In high-pressure areas, air descends toward the surface. As it sinks, the air compresses and warms, reducing relative humidity and creating dry conditions with minimal cloud formation. In the northern hemisphere wind blows away from and rotates clockwise around the center of a high pressure system. This rotation results from Earth's rotation and the Coriolis effect, which reverses in the southern hemisphere.
Low Pressure Systems
Rising air characterizes low-pressure systems. As air rises it cools causing its relativity humidity to increase which then often times causes clouds to form. Wind moves toward the center and rotates counterclockwise around these systems.
Wind Direction
The "right hand rule" helps predict wind patterns: point your thumb in the air's movement direction, and your fingers indicate rotation direction.
Isobars & Wind Strength
Pressure map intensity reveals wind strength. Closely spaced isobars indicate the strongest winds.
Impact on Thermals
High-pressure conditions produce smaller, sharper thermals that must overcome sinking air. Low-pressure days typically feature widespread lift and larger, softer thermals.